Setting up Validator Monitoring for Cosmos SDK Blockchains

This is a detailed tutorial on how to set up validator monitoring for Cosmos based blockchains with Prometheus and Grafana.
This tutorial is for people who want to quickly set up basic monitoring for their sentries and validators. The finer points of monitoring will not be addressed in this guide. The ownership will be on you to make the decision to dive deeper into this subject and research advanced methods.
Set up a Prometheus Server
The first thing that you will need to do is set up a Prometheus server. This will act as the central nervous system for your monitoring set up. Prometheus is a time series database that has very robust data scraping capabilities which will allow you to slurp data off of your nodes in near-real time and then archive it.
Our preference is to provision a dedicated server to run Prometheus, but you can certainly run this along with other programs. It is not recommended that you run Prometheus on the same server as a sentry or validator. You may drop blocks due to system resource competition.
Once you have your server, update it and install fail2ban to get some basic security. There are much better ways to improve server security than just fail2ban, but this is not a Linux security tutorial. Trust us, it’s better than nothing.
sudo apt-get update -y && sudo apt-get upgrade -y && sudo apt install fail2ban -yAs these packages install and update you will occasionally see a purple screen. Just hit the ENTER button.
Once Linux has updated, create a prometheus user which will be used to run Prometheus.
sudo groupadd --system prometheus
sudo useradd -s /sbin/nologin --system -g prometheus prometheus
Now do some file system housekeeping and then download and install Prometheus.
sudo mkdir /var/lib/prometheus
for i in rules rules.d files_sd; do sudo mkdir -p /etc/prometheus/${i}; done
mkdir -p /tmp/prometheus && cd /tmp/prometheus
curl -s https://api.github.com/repos/prometheus/prometheus/releases/latest | grep browser_download_url | grep linux-amd64 | cut -d '"' -f 4 | wget -qi -
tar xvf prometheus*.tar.gz
cd prometheus*/
sudo mv prometheus promtool /usr/local/bin/
Once the download is complete and Prometheus is unpacked, check to make sure that both Prometheus and Promtool are operational. You will see version numbers for both if you successfully completed the previous steps.
prometheus --version
promtool --version
One more bit of housekeeping, we are moving some files around like this:
sudo mv prometheus.yml /etc/prometheus/prometheus.yml
sudo mv consoles/ console_libraries/ /etc/prometheus/
Finally, let’s set up Prometheus as a service so that it runs all of the time!
sudo tee /etc/systemd/system/prometheus.service<<EOF
[Unit]
Description=Prometheus
Documentation=https://prometheus.io/docs/introduction/overview/
Wants=network-online.target
After=network-online.target[Service]
Type=simple
User=prometheus
Group=prometheus
ExecReload=/bin/kill -HUP \$MAINPID
ExecStart=/usr/local/bin/prometheus \
  --config.file=/etc/prometheus/prometheus.yml \
  --storage.tsdb.path=/var/lib/prometheus \
  --web.console.templates=/etc/prometheus/consoles \
  --web.console.libraries=/etc/prometheus/console_libraries \
  --web.listen-address=0.0.0.0:9090 \
  --web.external-url=SyslogIdentifier=prometheus
Restart=always[Install]
WantedBy=multi-user.target
EOF
Some more housekeeping:
for i in rules rules.d files_sd; do sudo chown -R prometheus:prometheus /etc/prometheus/${i}; done
for i in rules rules.d files_sd; do sudo chmod -R 775 /etc/prometheus/${i}; done
sudo chown -R prometheus:prometheus /var/lib/prometheus/
Now lets tell systemctl that we added the Prometheus service and then launch it.
sudo systemctl daemon-reload
sudo systemctl enable prometheus
sudo systemctl start prometheus
sudo systemctl status prometheus
If Prometheus is running succesfully you should have a status screen that looks like this. Press CTL+C to exit the systemctl status screen.

Update your firewall, this assumes you are using port 22 for SSH. If you are not using port 22, then change the command below or you will lock yourself out of your server.
sudo ufw allow proto tcp from any to any port 22
sudo ufw allow proto tcp from any to any port 9090
sudo ufw enable
Congratulations! You now have a Prometheus server running. We will come back to this for additional configuration. For now, enjoy this moment.
Set up a Grafana Server
The next step is to fire up a Grafana instance which will enable you to visualize the data within Prometheus from your computer and, more importantly, your smartphone! Contrary to popular belief, validator operators do have lives. Well, at least now you have a chance to have a life. Just make sure that you don’t obsess over your validators performance from your phone all of the time. Talk to other people sometimes, it can be interesting.
We recommend that you launch a dedicated server for Grafana. Ultimately Grafana will expose a webserver to the public internet and you may not want to comingle your Prometheus server. If you can, we recommend that you set up your Prometheus server and Grafana server on the same intranet. That way you can connect them privately without any need to use the public internet.
Anyways, once your server is ready for Grafana go ahead and install fail2ban. Again, this server is open to the internet so consider additional security measures like MFA and no root login.
sudo apt install fail2ban -yNow install some dependencies for Grafana
sudo apt-get install -y apt-transport-https
sudo apt-get install -y software-properties-common wget
wget -q -O - https://packages.grafana.com/gpg.key | sudo apt-key add -
Now update your package repos
echo "deb https://packages.grafana.com/enterprise/deb stable main" | sudo tee -a /etc/apt/sources.list.d/grafana.listInstall Grafana and upgrade your packages
sudo apt-get update -y && sudo apt-get install grafana-enterprise -y && sudo apt-get upgrade -yNow go ahead and run Grafana as a service. This is much easier than Prometheus:
sudo systemctl daemon-reload
sudo systemctl enable grafana-server
sudo systemctl start grafana-server
sudo systemctl status grafana-server
A successful install will look like this. Press CTL+C to exit the systemctl status screen.

Update your firewall, this assumes you are using port 22 for SSH. If you are not using port 22, then change the command below or you will lock yourself out of your server.
sudo ufw allow proto tcp from any to any port 22
sudo ufw allow proto tcp from any to any port 3000
sudo ufw enable
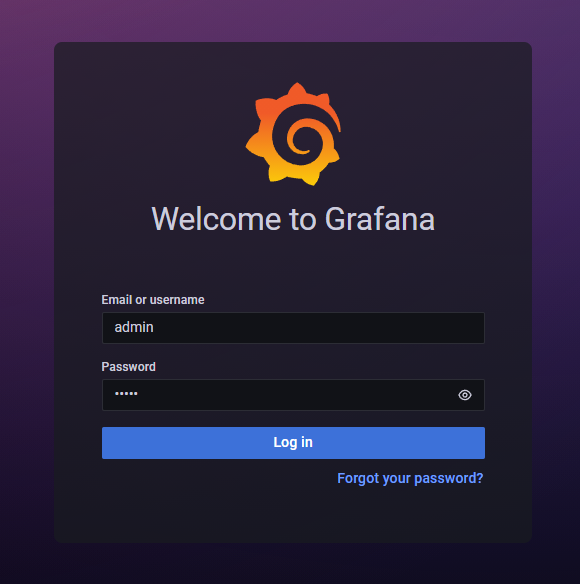
Now open a web browser and navigate to http://your.grafana.ip.address:3000 and you should see the Grafana logo start to bounce as the page loads. Your username is admin and your password is admin. If you don’t see the screen below, then your firewall is probably not open on port 3000 or you made a mistake somewhere in the previous steps.

Once you log in, click on the little avatar icon on the bottom left of the screen and then change your password. Please do this. Please.

After you change your password, open a new browser window and navigate here to download a standard Cosmos SDK Grafana dashboard. You will want to download the JSON file. Leave a review while you are at it. After 2 years, Yelong has no love yet!

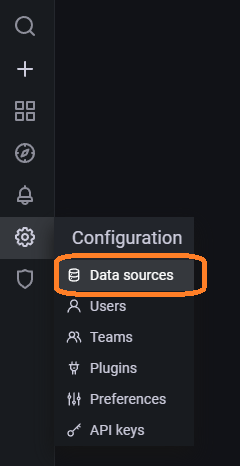
Go back to the Grafana page and then click on Configuration and then Data Sources

Now click on Add data sourcethen select the Prometheus data source.


Now enter the IP address with port 9090. If you decided to run Prometheus and Grafana on the same server that’s fine. Just remember that we told you not to. Go ahead with http://localhost:9090
If you went the path of having two servers, then enter the Prometheus IP address. For example http://100.200.300.400:9090

Scroll to the bottom and click the Save & test button.

If you entered the correct IP and your Prometheus firewall is open on port 9090 then you will see a connection success indicator.

Ok, that was fun. Now click on Dashboardand then Manage

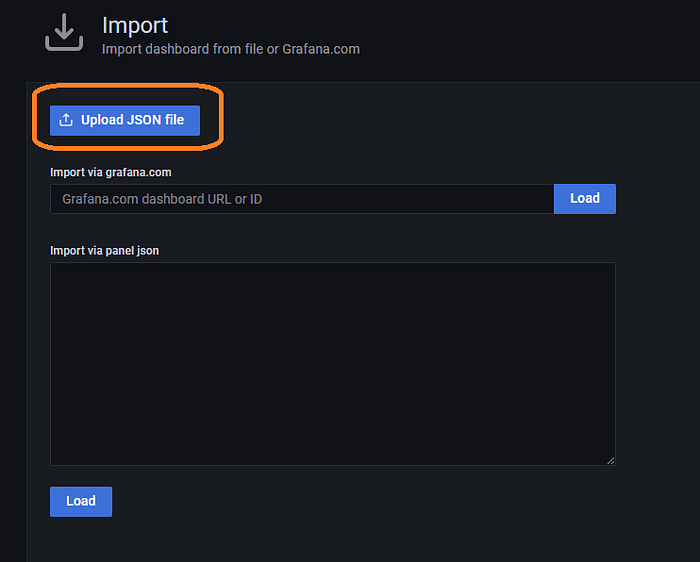
Now click on Import and then Upload JSON File


Upload the JSON file that you downloaded earlier and then select the Prometheus datasource that you just set up and then click on the Import button.


Congratulations! Now you have a pretty dashboard with absolutely no data!

We have one last bit of configuration to do before this starts to populate with data.
Configure Prometheus
Jump back in to your Prometheus server and edit the prometheus.yml file. Sorry if you are a vim lover, but we use nano here at Artifact. 😜
sudo nano /etc/prometheus/prometheus.ymlPaste in the following parameters and the yml file should look like this
- job_name: evmos-testnet
    static_configs:
      - targets: ['node.ip.address.here:26660']
This example will scrape an evmos testnet node. Feel free to change the job name to anything you like. The IP address should be for the Cosmos SDK node that you are scraping data from. This could be a sentry or a validator.

Once you correctly paste your job in, press Ctl + X, then the Y key, then the ENTER key.
Restart the Prometheus service and it will start scraping data
sudo systemctl stop prometheus
sudo systemctl start prometheus
Configure your Cosmos Node
This is the last step, you are almost there. Log into your Cosmos SDK sentry or validator and then open up the config.toml file. This example is for the Evmos blockchain.
nano ~/.evmosd/config/config.tomlHit PgDn on your keyboard to get to the very bottom of the file and then set prometheus=true

Once you correctly change the setting, press Ctl + X, then the Y key, then the ENTER key.
Poke a hole in your firewall so that your Prometheus server can scrape the port. You can change the port number in the config.toml file if you like. Just make sure your firewall is open on that port too. The following command assumes you are using port 22 for SSH. If you are not using port 22, then change the command below or you will lock yourself out of your server.
sudo ufw allow proto tcp from any to any port 22
sudo ufw allow proto tcp from any to any port 26656
sudo ufw allow proto tcp from any to any port 26660
sudo ufw enable
Now restart your node and you are set! Go back to your Grafana dashboard and the data will begin to populate within a few minutes.
